Denver Foothills Real Estate Market News June 2017
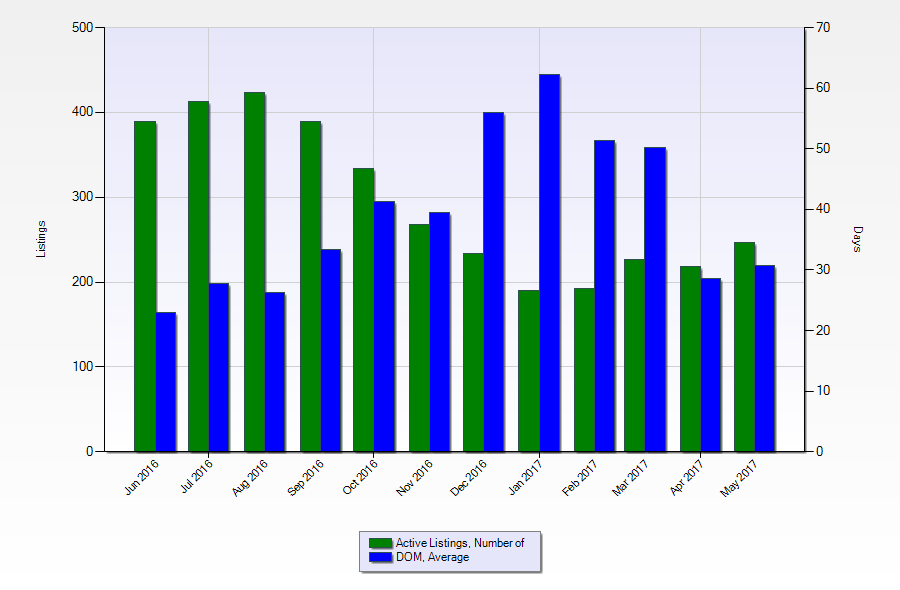
I might as well just copy and paste the last 3 months of market news right here and just change the date. Inventory is still just low as can be. Last month in my Denver Foothills Market News Video I explained just how low inventory was and unfortunately we have not seen much of an uptick in the last few weeks. The first set of data I would like to share is the chart below with days on market (DOM) and number of active listings. If you look at July of 2012, AKA the good ‘ol days, you will see we had 1,134 active listings. We currently have about 20%..yes I said 20% of that in active listing right now with about 218 listings in the Denver Foothills at the time this blog was written. Keep in mind these are listings for Evergreen, Conifer, Morrison and Bailey. Even last year the most active listings were in August with 423 units on the market.
| Month | DOM, Average | Active Listings, Number of |
|---|---|---|
| Jan 2012 | 140 | 974 |
| Feb 2012 | 135 | 933 |
| Mar 2012 | 154 | 933 |
| Apr 2012 | 151 | 990 |
| May 2012 | 114 | 1,091 |
| Jun 2012 | 110 | 1,125 |
| Jul 2012 | 87 | 1,134 |
| Aug 2012 | 99 | 1,096 |
| Sep 2012 | 110 | 1,044 |
| Oct 2012 | 83 | 959 |
| Nov 2012 | 81 | 866 |
| Dec 2012 | 154 | 789 |
| Jan 2013 | 127 | 692 |
| Feb 2013 | 103 | 694 |
| Mar 2013 | 130 | 674 |
| Apr 2013 | 104 | 738 |
| May 2013 | 70 | 854 |
| Jun 2013 | 58 | 928 |
| Jul 2013 | 82 | 923 |
| Aug 2013 | 56 | 884 |
| Sep 2013 | 67 | 771 |
| Oct 2013 | 63 | 638 |
| Nov 2013 | 83 | 495 |
| Dec 2013 | 127 | 409 |
| Jan 2014 | 97 | 364 |
| Feb 2014 | 86 | 361 |
| Mar 2014 | 74 | 406 |
| Apr 2014 | 78 | 441 |
| May 2014 | 74 | 508 |
| Jun 2014 | 51 | 547 |
| Jul 2014 | 37 | 555 |
| Aug 2014 | 44 | 539 |
| Sep 2014 | 52 | 481 |
| Oct 2014 | 66 | 438 |
| Nov 2014 | 64 | 351 |
| Dec 2014 | 76 | 305 |
| Jan 2015 | 72 | 258 |
| Feb 2015 | 79 | 256 |
| Mar 2015 | 73 | 262 |
| Apr 2015 | 51 | 304 |
| May 2015 | 37 | 355 |
| Jun 2015 | 30 | 411 |
| Jul 2015 | 30 | 478 |
| Aug 2015 | 33 | 453 |
| Sep 2015 | 36 | 418 |
| Oct 2015 | 53 | 361 |
| Nov 2015 | 43 | 298 |
| Dec 2015 | 61 | 235 |
| Jan 2016 | 46 | 208 |
| Feb 2016 | 58 | 207 |
| Mar 2016 | 49 | 253 |
| Apr 2016 | 52 | 301 |
| May 2016 | 33 | 322 |
| Jun 2016 | 23 | 389 |
| Jul 2016 | 28 | 413 |
| Aug 2016 | 26 | 423 |
| Sep 2016 | 33 | 389 |
| Oct 2016 | 41 | 334 |
| Nov 2016 | 40 | 268 |
| Dec 2016 | 56 | 234 |
| Jan 2017 | 62 | 190 |
| Feb 2017 | 51 | 192 |
| Mar 2017 | 50 | 227 |
| Apr 2017 | 29 | 218 |
This next chart is the same story as the last few months. At least as far as number of listings in the Denver Foothills. There is a slight contradiction in the supply and demand. Seems like buyers took a little break (as they usually do) over the winter months this year. If you see the decline in inventory from August to pretty much March but the DOM rose. Usually (in a seller’s market like we have now inventory and DOM usually go hand in hand. Meaning since inventory was declining so should the DOM. Again this might just be the seasonal cycle we usually see but still the two should be more closely related.
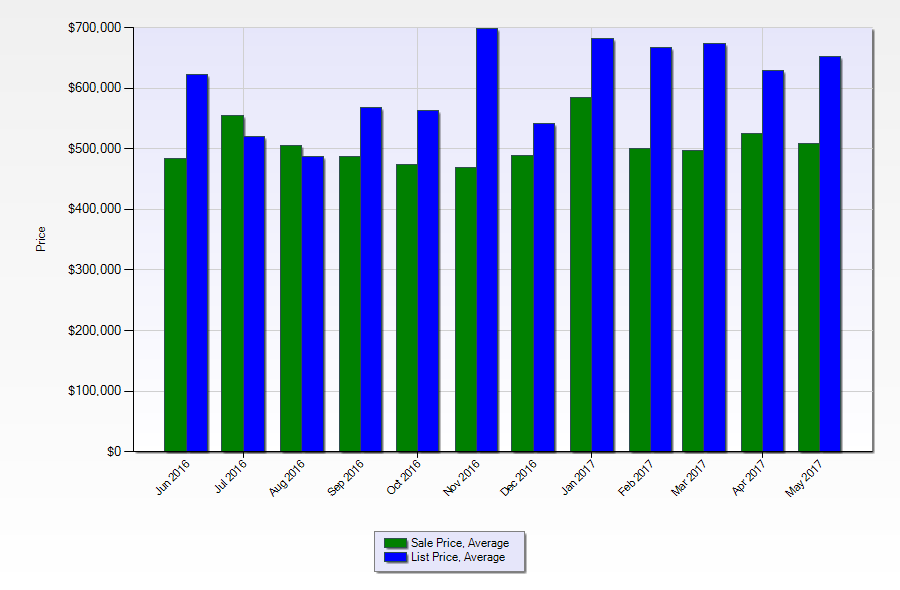
The next chart is the average sale price (green) and the average list price (blue). You will notice that the average sale price has been hovering around 500K all year. Keep in mind we have a very small number of sales the last year compared to years past but it seems like prices are going to hold for the near future. We were hoping to get some more inventory this summer and that would certainly help confirm the current market levels. It would be nice to have a lot of comps as confirmation.
 In conclusion the Denver Foothills Real Estate Market is still lacking in inventory and still is in desperate need of more active listings. If to only give my poor buyers more choices. It is hard enough to find the perfect home in a market with high inventory. I still think all the Realtors in the Denver Foothills area think the same thing, now is a fantastic time to list!